| • |
CPSC Clarifies eFiling Rules as Mandatory Deadline Takes Effect: The Consumer Product Safety Commission (CPSC) issued guidance July 7 clarifying trade party and Product Registry requirements as the July 8 deadline mandating full eFiling for CP2-flagged products took effect. |
| • |
Once a trade party is added to a business account, it shouldn’t be duplicated; if information changes, users must create a new trade party entry rather than editing the old one. |
| • |
CPSC-accepted laboratories should never be added to the Product Registry directly; filers should reference the existing accepted-lab list and cite only the lab’s four-digit CPSC ID. |
| • |
Certificate data may only be submitted in English. Certificate updates can be stacked to preserve a product’s full history, or filers can create new, unlinked certificates when no update to an existing certification is being made. |
| • |
The "getImportStatus" function shows processing state only, not certificate success or failure. Use "getImportLog" for error codes, and wait at least two seconds after initiating an import before checking status. |
| • |
Per National Customs Brokers & Forwarders Association of America (NCBFAA) guidance, certificate data is mandatory for CP2-flagged Harmonized Tariff Schedule (HTS) codes with no disclaims permitted, while CP1-flagged codes permit but don’t require a disclaim filed under an Intended Use Code. |
| • |
Missing CP2 certificate data won’t block entry yet, but will raise an importer’s U.S. Customs and Border Protection (CBP) risk score, increasing the odds of a hold or exam. The API supports bulk uploads up to roughly 10,000 products, a 5,000-character limit per certificate, and a rate limit of five calls per second. |
| • |
CBP Rejects Warehouse Entries on CAPE Declarations: As of July 7, CBP no longer accepts warehouse entry types 21 and 22 on Consolidated Administration and Processing of Entries (CAPE) declarations, per a CBP CSMS message; filers attempting to do so will receive an "ENTRY TYPE NOT ALLOWED" error. |
| • |
Warehouse withdrawal entry types 31, 32, 34, and 38 remain acceptable on CAPE declarations, since International Emergency Economic Powers Act (IEEPA) duties were already paid at withdrawal; CBP will issue refunds on those upon reliquidation of the underlying warehouse entry. |
| • |
Entry types 21/22 filed on CAPE declarations between April 20 and July 6 without a matching withdrawal won’t be liquidated or reliquidated for IEEPA refunds; filers must submit a new declaration reflecting the withdrawal on which IEEPA duties were paid. |
| • |
Importers with warehouse entries filed in that window should review their filings now to confirm a compliant withdrawal declaration is on record and refund eligibility is preserved. Flexport’s Audit Your Customs Broker tool can help flag entries at risk of missing IEEPA refunds. |
| • |
Commerce Opens Section 232 Investigation Into Anthracite Coal: The Commerce Department confirmed July 2 that it launched a Section 232 national security investigation June 29 covering anthracite coal (HTSUS 2701.11.0000) and metallurgical bituminous coal (2701.12.0010). |
| • |
Comments are due July 21 on whether domestic anthracite production can meet U.S. demand, the feasibility of expanding domestic capacity, whether tariffs or quotas are warranted, the effect of foreign predatory trade practices, manufacturing employment impacts, and the likelihood of foreign export controls on anthracite. |
| • |
Context from the U.S. Energy Information Administration (EIA): the U.S. remains a large net exporter of coal overall, with Q1 2026 exports of 23.7 million metric short tons against just 737,000 metric short tons of imports. Metallurgical coal exports rose almost 5% year over year to roughly 13 million metric short tons in Q1, led by India, Brazil, Indonesia, and the Netherlands. |
| • |
Anthracite itself is a narrow slice of the market, about 1% of domestic coal production, with output up 8% year over year through June 27. The U.S. is a small net exporter of anthracite as well, with both exports and imports under 1 million metric short tons annually. |
TRANS-PACIFIC EASTBOUND (TPEB)
| • |
Planned TPEB capacity for July is at its highest level in at least three and a half years. |
| • |
Carriers cancelled about 2% of scheduled TPEB capacity in Week 27 (June 29), easing to under 1% in the current week (July 6), among the lowest cancellation levels in two months. |
| • |
Forward data for Weeks 28 to 30 point to continued low cancellation rates. An increase to about 9% is projected for Week 31 (July 27), though forward weeks should be treated as directional given incomplete bookings. |
| • |
Panama Canal draft limits tighten further on July 24, and carriers are applying weight restrictions on services routed through the canal to the U.S. East Coast and Gulf. |
| • |
Shippers continue to front-load cargo ahead of the July 24 expiration of the Section 122 import tariff. U.S. June import volumes rose 14.3% year over year to 2.25 million TEU, adding to congestion at major gateways. |
| • |
Global container demand growth is outpacing vessel supply growth industry-wide. Freight rate indices rose about 7% week over week on both the U.S. West Coast and U.S. East Coast in the most recent reading, extending several consecutive weeks of increases. |
| • |
Congestion at U.S. ports and new Panama Canal weight restrictions raise the risk of rolled cargo on East Coast and Gulf routings. Shippers are advised to book 4 to 6 weeks in advance. Confirm allocation early, and consider premium service for time-sensitive freight. |
| • |
Carriers implemented rate increases on July 1 across all TPEB lanes. |
| • |
A Peak Season Surcharge (PSS) remains active through July 14. |
| • |
Bunker Adjustment Factor (BAF) rates increased for the third quarter across all TPEB corridors. |
| • |
Tight scheduled capacity against strong demand is expected to support continued rate strength through July. |
FAR EAST WESTBOUND (FEWB)
| • |
Carriers cancelled about 26% of scheduled FEWB capacity in Week 26 (June 22), dropping to near zero in Weeks 27 and 28 (June 29 to July 6). |
| • |
A new round of cancellations is scheduled to build from mid-July, reaching about 8% in Week 29 (July 13) and climbing toward 14% by Week 32 (August 3). Treat these forward figures as directional. |
| • |
Red Sea and Houthi attacks continue on an intermittent basis; a cargo ship was attacked off Yemen on July 5, with the crew reported safe. The share of Asia-Europe cargo transiting the Suez Canal remains near 19%, still far below the 80% level seen before the disruption began in late 2023. |
| • |
Most carriers continue to route FEWB services via the Cape of Good Hope, adding 10 to 14 days per voyage, which continues to reduce effective fleet availability across the trade. |
| • |
Peak season demand remains firm on Asia-Europe lanes. |
| • |
Recent readings show freight rate indices for Mediterranean lanes rising faster than North Europe lanes, with Shanghai-Genoa rates up about 10% and Shanghai-Rotterdam up about 7% week over week. This reflects continued demand for Mediterranean discharge options amid the ongoing Red Sea disruption. |
| • |
Book 4 to 5 weeks in advance. Expect renewed space pressure from mid-July as cancellation activity picks up. Shippers with routing flexibility should evaluate all discharge port options. |
| • |
A Peak Season Surcharge (PSS) remains active through July 14. |
| • |
Bunker Adjustment Factor (BAF) rates increased for the third quarter. |
| • |
Mediterranean lanes continue to carry a rate premium over North Europe lanes tied to Cape of Good Hope routing. |
TRANS-ATLANTIC WESTBOUND (TAWB)
| • |
Carriers cancelled about 19% of scheduled TAWB capacity in Week 26, easing to 3-4% in Weeks 27 and 28. |
| • |
Scheduled data for later weeks show renewed cancellation activity building into late July and August. TAWB capacity data carries smaller sample sizes than the other trades, so treat forward figures as directional only. |
| • |
July is expected to be the last strong demand month before European summer warehouse closures reduce shipping volumes in August. |
| • |
Shippers are advised to book 3 to 4 weeks in advance. Confirm space early for Gulf Coast and U.S. West Coast destinations ahead of the seasonal slowdown expected in August. |
| • |
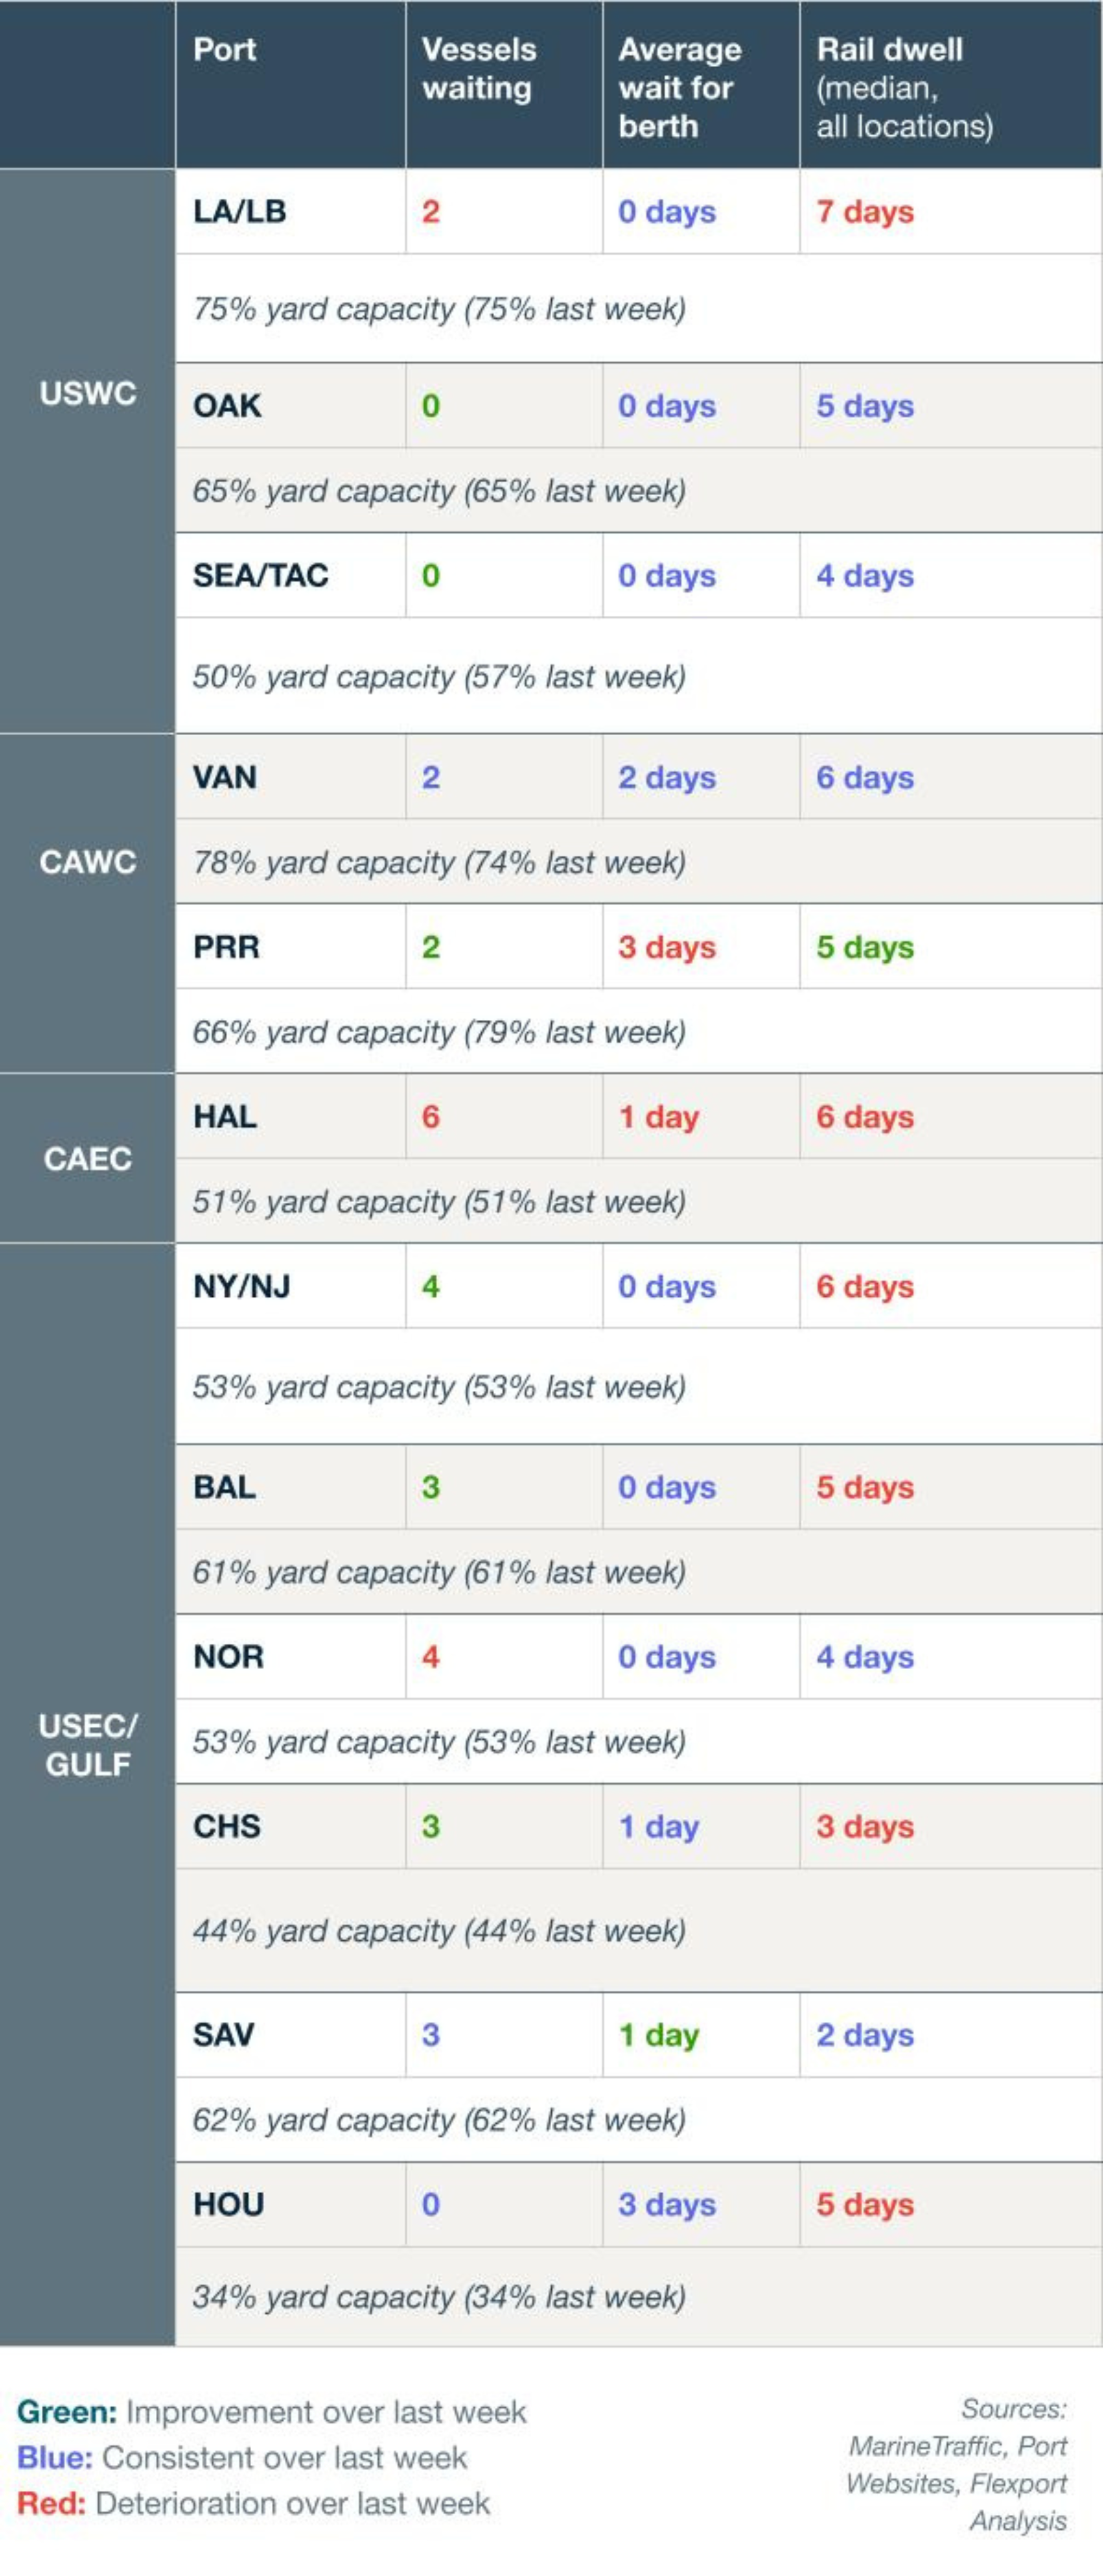
North Europe ports remain congested and with yard utilization over 90%. |
| • |
Mediterranean ports show high waiting time in some ports (i.e. Valencia). |
| • |
Rates from Northern and Western Europe to the U.S. remain stable in July. Eastern Mediterranean rates are increasing in July due to the high demand. |
| • |
Bunker Adjustment Factor (BAF) rates rose for the third quarter versus the second quarter across corridors. Once BAF reflected the real fuel cost, almost all the carriers decided to cancel the Emergency Fuel Surcharge (EFS) and Emergency Bunker Surcharge (EBS) in July. |
INDIAN SUBCONTINENT TO NORTH AMERICA
| • |
The Indian Subcontinent (ISC) to the U.S. and Canada remains in peak season, and outlook remains strong through July into August. |
| • |
The demand increases that began in May have continued with that trend. |
| • |
There are less structural blanks in July compared to June, but the cluster of blanks in June and a carrier’s sudden removal of an ISC to East Coast service continues to impact the market. |
| • |
The combination of increases in demand and capacity constraints occurring at the same time is contributing to the backlog of cargo that has developed at origin. |
| • |
Book 4 to 6 weeks in advance and get the Cargo Ready Date confirmed by shippers at origin as soon as possible. |
| • |
A Peak Season Surcharge (PSS) is active through July 14, and expected to remain through July into August on heels of demand increase and constrained capacity. |
| • |
FAK rates are set to increase into the second half of July. |
| • |
Bunker Adjustment Factor (BAF) rates increased for the third quarter. |
| • |
Trans-Pacific Eastbound rates rose again this week. |
| • |
U.S. West Coast space is being squeezed by Southeast Asia transit cargo (mainly Thailand-origin electronics), front-loading ahead of the July 8 Consumer Product Safety Commission deadline, and ocean cargo shifting to air following General Rate Increases (GRIs). |
| • |
One carrier raised PVG-LAX rates four times in a single week, and others have matched or are expected to follow. |
| • |
On the U.S. East Coast, a cluster of e-cigarette project cargo is squeezing space to ORD this week, pushing rates up slightly versus last week. |
| • |
The China-to-Europe lane held flat, with a soft outlook as summer holidays approach. |
| • |
Trans-Pacific Eastbound demand ticked up slightly as an ad-hoc charter ended over the weekend. |
| • |
Far East Westbound demand kept softening and is expected to stabilize. |
| • |
Demand softened modestly, and rates held flat week over week. |
| • |
Carriers are discounting dense carton shipments. |
| • |
Book 5 to 7 days in advance where possible. |
| • |
Demand is set to ease slightly this week as available capacity out of China pulls Trans-Pacific Eastbound rates down. |
| • |
Book 5 to 7 days ahead of the cargo-ready date to secure space. |
| • |
Demand is expected to pick up next week, and rates are staying high. |
| • |
Book at least 7 working days in advance to secure space. |
| • |
Trans-Pacific Eastbound demand slowed compared with last week, though space is still available 3 to 4 days out from gate-in. |
| • |
Rates held steady on both Trans-Pacific Eastbound and Far East Westbound. |
| • |
Project cargo, mainly solar panels and server racks, is driving uplift delays out of Kuala Lumpur and Penang through July 8 to 10, with carriers requiring express pricing for earlier departures. |
| • |
Ongoing congestion at U.S. ports is keeping Trans-Pacific Eastbound capacity tight. |
| • |
Spot rates rose this week on the tighter conditions. Book at least 10 days in advance. |
| • |
Demand is set to soften slightly after quarter-end, with carriers reporting more open capacity as China and Hong Kong volumes ease. |
| • |
Rates dipped slightly this week. |
| • |
Book 5 to 7 days in advance. |
| • |
Conditions held steady with no space constraints reported; booking lead times remain around 7 days. |
| • |
Rates are flat to soft. |
| • |
Ocean container congestion and vessel backlogs at major U.S. ports continue pushing shippers toward air, tightening capacity on lanes from India to the U.S. |
| • |
Book about 1 week in advance. |
| • |
Indian subcontinent (Bangladesh, Sri Lanka, Pakistan): |
| • |
Sri Lanka is largely unchanged, with previously delayed carriers now back on schedule and fuel surcharges continuing to ease. Middle East-based carriers remain space-constrained on rising perishable volumes. |
| • |
In Bangladesh, the EU lane stayed reliable, while the U.S. lane remains tighter and less consistent. |
| • |
Pakistan remains the tightest market in the subcontinent, with capacity fully committed and airlines quoting only 1 to 2 days of rate validity. |
(Source: Flexport)
Please reach out to your account representative for details on any impacts on your shipments.
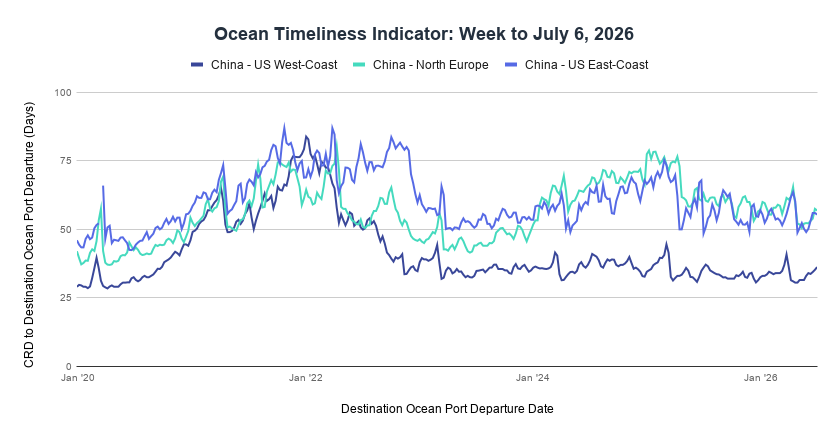
Week to July 6, 2026
Transit time remained stable from China to the U.S. West Coast, increased from China to the U.S. East Coast, and decreased from China to North Europe.
Transit time increased from 35.2 days to 36.2 days from China to the U.S. West Coast; decreased from 56 days to 55.4 days from China to the U.S. East Coast; and decreased from 57.5 days to 56.9 days from China to North Europe. Thanks for tuning in. Catch you next week! Sign up here to get this newsletter in your inbox. Stay in the loop—read past newsletters here. For more information, connect with one of our logistics experts here.
| Follow us for more updates: |
 |
 |
©2026 Flexport, Inc. – All Rights Reserved. 100 California Street, FL 5, San Francisco, CA 94111.
This email was sent to your address because you’re opted into Flexport’s Global Logistics Updates. Want to change what communication you receive? You may update your email preferences or unsubscribe below.
|