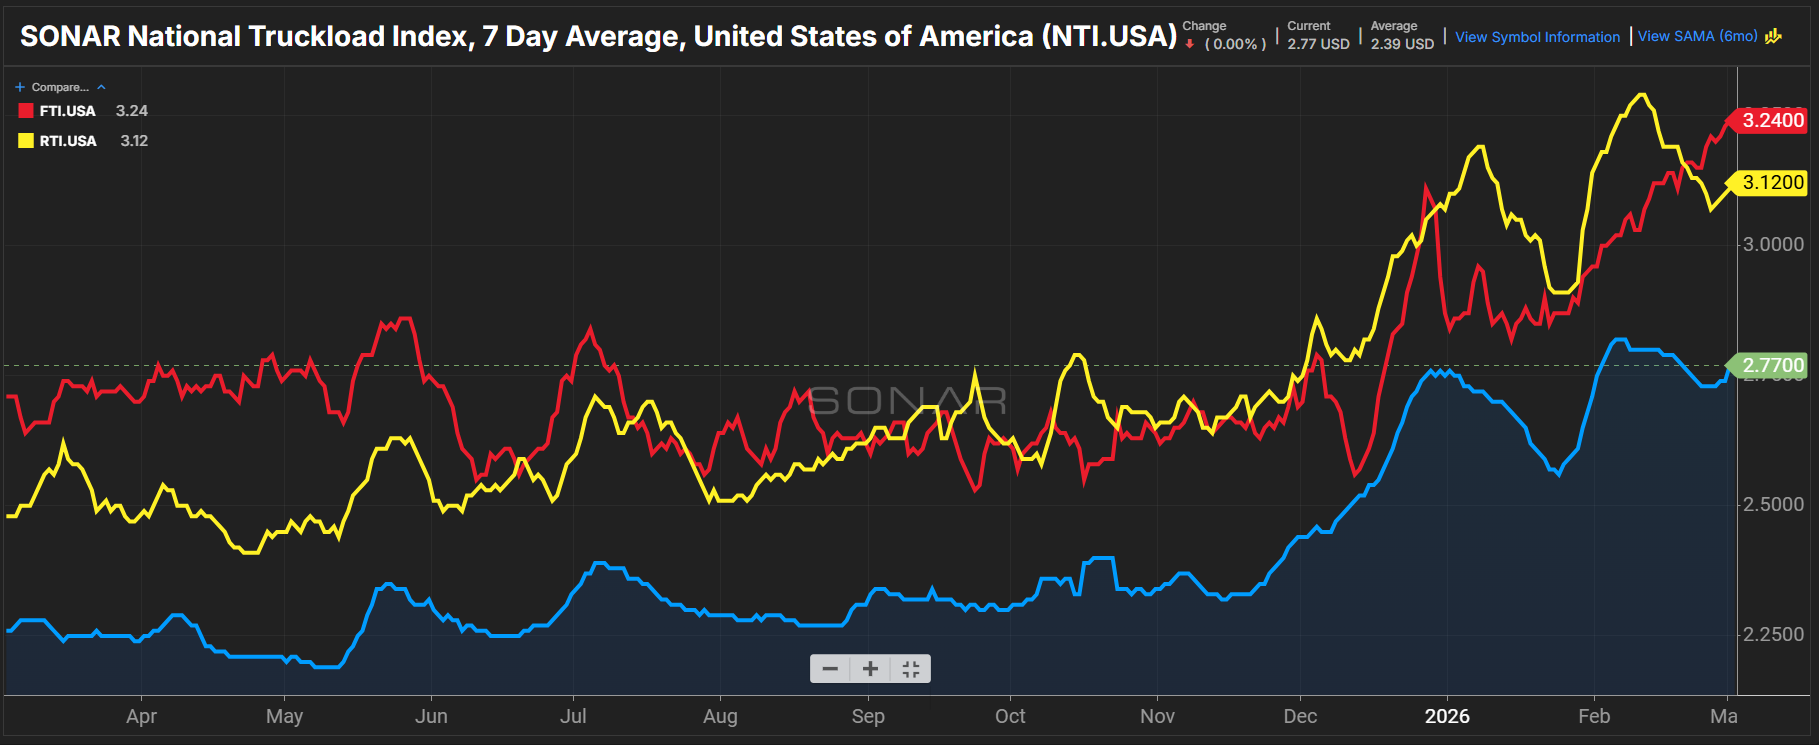
Summary: The end of February saw a continued rally in flatbed spot market rates. Dry van spot rates saw gains while reefer posted a slight decline.
Flatbed capacity tightening remains the recurring theme. The Flatbed Truckload Index (FTI) rose 9 cents per mile all-in, week over week, from $3.15 on Feb. 23 to $3.24. The FTI is 24 cents per mile, or 8%, higher than $3.00 last month and 53 cents per mile, or 19.6%, higher than $2.71 last year.
Higher flatbed spot rates are coinciding with record flatbed tender rejection rates. The SONAR Truckload Rejection Index – Flatbed (STRIF) jumped 803 basis points, week over week, from 35.17% on Feb. 23 to 43.20%. The STRIF is 1,402 basis points higher than 29.18% last month and 1,837 basis points higher than 24.83% last year.
Dry van spot market rates saw week-over-week gains. The SONAR National Truckload Index 7-day average (NTI) rose 4 cents per mile, or 1.5%, week over week. The NTI is 2 cents per mile lower than last month’s $2.79. Compared to last year, the NTI is 51 cents per mile, or 22.6%, higher than $2.26.
Other datasets are also showing improvements in carrier pricing power. February’s recent release of the Logistics Managers’ Index showed its transportation prices index growing at the fastest pace in four years.
FreightWaves’ Todd Maiden writes, “The squeeze on capacity was widespread but especially pronounced at large companies (1,000 employees or more), which reported a contraction rate of 32.6.”
Larger truckload carriers are more heavily exposed to the contract market. If these larger upstream carriers are declining freight at greater levels than smaller fleets, this would suggest early signs of routing guide failures, either due to rates or insufficient truckload capacity.